
Introducing Data Apps: Build custom apps on top your governed data


I use Cursor every day. It’s where I think, write, and ship work.
That’s why it feels odd that building dashboards still means switching context. Data teams have to click around a UI, recreate logic that already exists in code, and hope nothing breaks along the way.
I decided to fix that. I used Lightdash to build and edit dashboards entirely inside Cursor, using plain English with governance, version control, and a real semantic layer underneath.
That is what’s possible with an AI-native BI tool.
AI-native BI vs AI on top of BI
A lot of tools talk about “AI in BI.” Usually that means a chatbot that answers questions about your data. You ask, it queries, you get a number. That’s AI on top of BI - helpful, but limited.
Lightdash gives you AI-native BI because your entire BI layer is code:
- Dashboards are YAML files in your repo
- Metrics are defined in a governed semantic layer
- Changes flow through version control
- An MCP server exposes everything to AI tools
That's what makes AI development possible. AI can't help you build dashboards if there's nothing for it to build with. Lightdash gives it the raw materials.
Building dashboards with Cursor
My setup
- A dbt project with a defined semantic layer
- Lightdash CLI
- Cursor as my IDE
- Lightdash MCP + docs MCP connected to Cursor
The MCP connections are what give Cursor the context it needs. It can see my semantic layer, understand Lightdash's chart schema, and actually do things in my Lightdash instance.
My actual workflow
Step 1: Open my dbt project in Cursor. Data models, semantic layer, and dashboards all live in the same repo.
Step 2: Download the dashboard using the Lightdash CLI:
lightdash download -d <dashboard url>
If you're already version controlling your dashboards in your dbt project, you might not need this!
This pulls down the dashboard as readable, version-controlled YAML.
Step 3: Tell Cursor what I want in plain English:
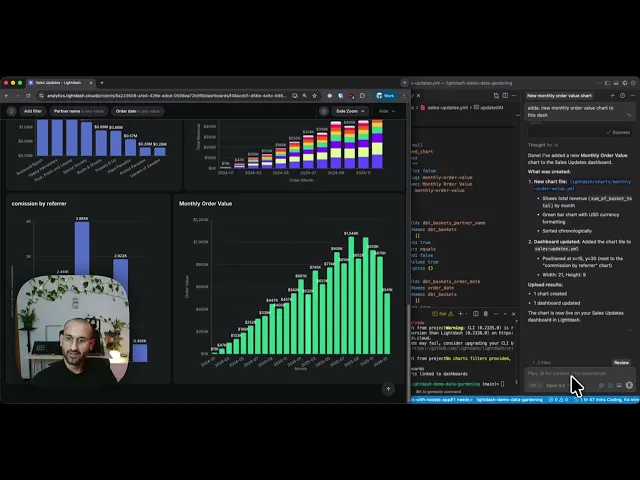
"Add a new monthly order value chart to this dashboard"
Step 4: Cursor creates the chart YAML, adds it to the charts folder, updates the dashboard config, and even decides where the chart should go on the layout.
Step 5: Cursor runs lightdash upload to sync everything back.
Done. The chart is live and the change is in my Git history. If something breaks, I can revert it like any other code change.
Editing dashboards with Cursor
Creating the chart was fast, but what was even better is how easy it was to edit. I asked Cursor to:
"Add some fancy useful tooltips to the chart"
I didn't specify what "fancy" meant or list which fields to include. Cursor figured out that for a monthly order value chart, useful tooltips would include total revenue, order volume, and average order value. It edited the YAML, uploaded the changes, and the tooltips appeared.
This is what AI-native BI development should feel like. You describe intent, and the AI (armed with full context about your data) handles implementation details.
What this unlocks
Honestly, the tooltip moment is what sold me. I didn't have to remember field names or look up syntax. Instead, I just described what I wanted and the AI made a sensible decision.
That's the shift data teams need to look for. Traditional BI tools make you think in their terms: which field goes on which axis, what aggregation, what filter. AI-native BI lets you think in your terms, i.e., "make this chart more useful."
But this only works if your BI tool is built for it. You need dashboards as code, a semantic layer the AI can reference, and an MCP server so the AI can actually interact with your instance.
That's what Lightdash gives you.
Want to try it yourself?
Start your free Lightdash trial and connect it to Cursor in about 15 minutes.
Questions after watching the demo? Find me on LinkedIn. I’m always happy to chat about AI workflows for data teams.





Inbound fails when leads don't get the right response fast enough.
Make every inbound lead count.